Dragonfly Doji: How to Spot and Trade Candlestick Patterns
The Dragonfly Doji is a specific type of candlestick pattern that can occur at the end of an uptrend. It’s important to understand what this candlestick means for your trading strategy because it could be an opportunity to take advantage of the market or it may indicate that the trend has ended.
In this article we will dive into how to spot a dragonfly doji. The best strategy to trade it and examples of how they have played out in the past.
How to identify dragonfly doji?
Dragonfly Doji candlestick patterns have four main parts to look out for:
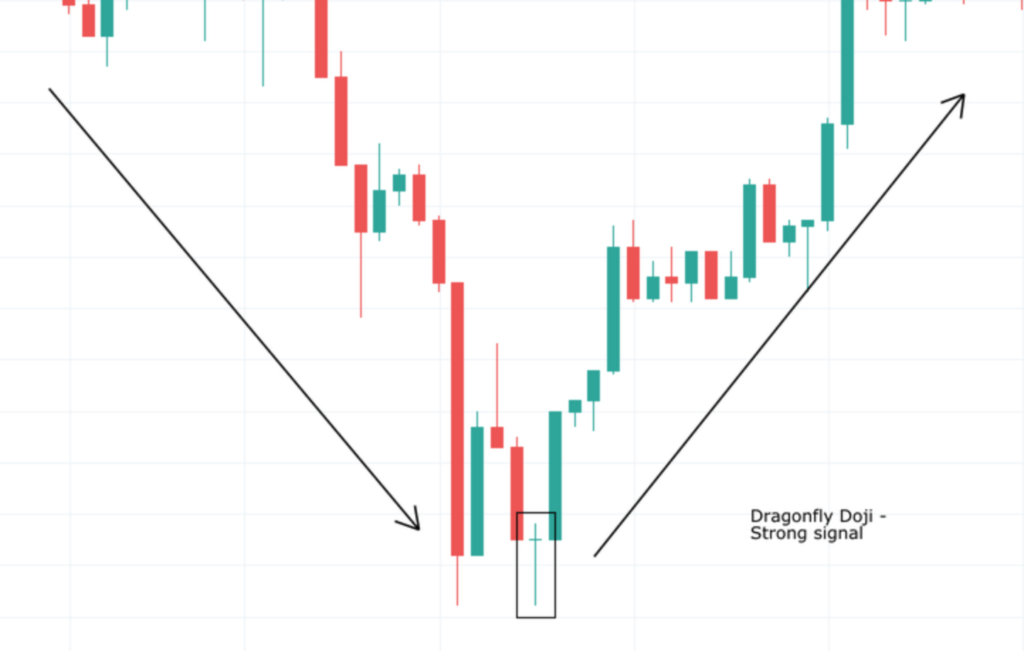
Dragonfly dojis have a long upper shadow with almost no lower wick which indicates that the buyers were able to push prices up but failed to hold on to these gains before new sellers took over causing a price drop back down again.
This would indicate that there was strong buying pressure leading into this candlestick but whether it will continue depends on what happens next as we cannot tell from looking at just one candle how much momentum has shifted over to the new trend without looking at other indicators such as volume, price action and key levels.
Dragon fly doji candles can be tough because although they may look like bullish patterns, some traders see them instead as neutral until further confirmation comes through after another candle appears.
What does it mean when Dragonfly Doji appears?
Dragonfly Doji indicate that there may be an imminent change in market sentiment or some sort of reversal from bullishness to bearishness happening soon. The Dragonfly pattern acts as a warning sign to other traders.
Many traders use the Dragonfly Doji as an official warning signal of reversal in your trading strategy, so you want to act on it quickly before the trend resumes.
Is the dragonfly doji bullish or bearish?
Dragonfly doji can be both. Dragonfly Dojis are characteristically the result of extremely high volatility and indecision in a market which creates an even balance between bulls and bears, making it very difficult for either side to push their advantage over the other.
The Dragonfly pattern is therefore somewhat neutral in its nature but you should still develop your strategy around how this candlestick works depending on what type of trader you are whether bullish or bearish if Dragonfly Doji appears during uptrends or downtrends respectively.
How to trade dragonfly doji?
If Dragonfly Doji appears during an uptrend you should develop a bullish trading strategy because Dragonflies indicate that there is still demand for the market and it could continue to go higher.
In this case, traders may want to see if Dragonfly has any confirmation which will be seen in its next candle or candles after it occurs.
Some examples of ways Dragonflies can show signs of confirming further upward movement would be:
- Piercing Line Breaking through key resistance levels
- Meeting/Touching highs
- Low Volume Candle Bullish Engulfing Pattern
If all three conditions are met then traders who have spotted these clues may consider going long on their chosen instrument as Dragonfly Dojis often lead into strong moves upwards.
In contrast, Dragons appearing during downtrends indicates that the Dragonfly Doji is a warning sign of an impending reversal and traders may want to consider how best to protect their capital as price action could be about to turn into bearish.
Some examples of signals Dragonflies can give during downtrends would be:
- Dark Cloud Cover
- Piercing Line Under Neckline
- Bullish Engulfing Pattern
If all three conditions are met then there maybe opportunities for short trades on Dragonfies appearing during downturns.
However, you should always remember that Dragonfly Dojis tend to occur at very high levels so it will require exceptional volume and volatility in order for them to show any form of confirmation after they appear which means taking advantage of these situations may not come around often or even happen at all.
Dragonflies can often be tough to trade because they are so rare and require confirmation through other technical indicators or price action before you act on them, but it is potentially very rewarding if you manage to successfully predict the next move correctly based on Dragonfly Doji.
Can a dragonfly doji be red?
Dragonfly Dojis are said to be red or green depending on the direction of their next candle. Dragonflies that appear during uptrends will often show as a green Dragonfly and vice versa for downtrends.
These patterns can even be shown in multiple timeframes which means you should always plan your trades around them carefully before acting based on what type Dragonfly you see (red/green) and where it appears (higher timeframe trend).
The last thing any trader wants is to act too early because Dragonfies need confirmation from other technical indicators, price action or volume so if they don’t have it then traders shouldn’t place any orders until these criteria have been met first.
Important Takeaways of the Dragonfly Doji
- – Dragonfly Dojis are characteristically the result of extremely high volatility and indecision in a market
- – Dragonflies can often be tough to trade because they are so rare and require confirmation through other technical indicators or price action before you act on them, but it is potentially very rewarding if you manage to successfully predict the next move correctly based on Dragonfly Doji.
- – Dragonflies appear during uptrends will show as a green Dragonfly and vice versa for downtrends. These patterns can even be shown in multiple timeframes which means traders should always plan their trades around them carefully before acting based on what type Dragonflies (red/green) they see where it appears (higher timeframe trend)
The Dragonfly Doji candlestick pattern is a very difficult one to trade which often leads many traders down the wrong path. Dragonflies indicate that there may be an impending trend change but they require confirmation from other indicators and price action before you act on them – never rush your trades based only on Dragonflies as there could be better opportunities elsewhere or even worse make a bad decision entirely.
It’s best for Dragonfly Dojis to appear during uptrends because this indicates strong buying pressure within the market, meaning it should carry momentum upwards if confirmed correctly by volume and volatility futures etc.. However, Dragonflies appearing in downtrends can also show potential reversal signals although these are less than those seen during uptrends. Dragonflies during downtrends will often be red and show as a warning sign of an impending trend change which can lead to strong bearish price action.
There is potential for Dragonflies when they appear in higher timeframes but traders must always remember that these types of patterns are very rare so if you trade them without confirmation from other technical indicators or even volume then there could potentially be better opportunities elsewhere. Dragonfly Dojis look really cool on charts though!